

Welcome to the Magellan Logistics freight market update for September 2026. This freight market update lands in the middle of a genuine divergence: Intra-Asia rates are at their highest point in three years, Australian carriers are stacking a second-rate restoration inside a fortnight, and two of the world’s key shipping chokepoints, the Strait of Hormuz and the Panama Canal, are constrained for entirely different reasons. None of it points to a single crisis. It points to a market where disruption is the baseline, and where planning ahead beats reacting.
This update draws on the latest figures from Drewry, Sea-Intelligence, WorldACD, the OECD, Australian Border Force and the Freight and Trade Alliance, translated into what they mean for importers and exporters across Australia and New Zealand.
TL;DR – Global Freight Market Update September 2026 (16 September 2026)
- Intra-Asia freight rates have hit their highest level in over three years, driven by typhoons disrupting Chinese ports rather than demand, causing vessel delays and congestion flowing through to major transhipment hubs, including Singapore.
- Australian carriers have stacked rate restorations for 1 and 15 September, and the blank sailing rate has lifted from 6.0% to 9.0%.
- Global schedule reliability fell to its weakest point of 2026, with average vessel delays now past six days.
- The Strait of Hormuz remains a severe threat, and fresh Houthi activity is testing the Red Sea recovery, while water constraints have cut Panama Canal transit capacity.
- Equipment remains tight worldwide, with close to one in three containers now moved empty.
- A new 12.5% additional US tariff on most Australian-origin goods is now in effect.
Freight Market Update: Middle East Disruption
Renewed hostilities between the United States and Iran have unsettled a fragile calm in the Strait of Hormuz. Reported mine strikes, attacks on merchant vessels and conflicting assessments of which lanes are genuinely clear, US Central Command and the more cautious Joint Maritime Information Center do not fully agree, make commercial planning difficult. The Strait is now rated a severe threat, and the International Maritime Organization estimates around 400 vessels and 6,000 seafarers remain unable to leave the Gulf safely.
Very little Australian cargo transits Hormuz directly, but higher bunker and war-risk costs, tighter capacity, and carrier caution still flow through to freight rates and reliability. Further west, Houthi forces have reportedly seized the Yemeni port city of Mocha, and the Bab el-Mandeb threat remains substantial. Even so, Maersk, Hapag-Lloyd, CMA CGM, COSCO and now MSC have resumed selected Red Sea transits, weighing diversion costs against security risk. Routing remains service-specific and can change with little notice.
What This Means For You:
Build contingency into your planning now if your supply chain depends on Gulf-adjacent routing or precise timing. We track carrier routing daily and can talk through what a Hormuz or Red Sea disruption means for your lane. Speak to an expert about your exposure.
Freight Market Update: Panama Canal Water Constraints
A different pressure is building on the other side of the world. Reduced rainfall in the Panama Canal watershed, attributed by the Panama Canal Authority to below-expected precipitation and El Niño, has cut daily transit slots from 34 to 32, with the Panamax allocation falling further, from 25 to 23, from 15 September. The Authority has warned vessels without confirmed reservations to expect longer waits.
The canal is not a primary route for most Australia-bound cargo, but it is used on some services, and it reminds us that chokepoint risk is not confined to the Middle East this year. Where it applies, the consequences look familiar: longer transit times, revised schedules and possible carrier surcharges.
What this means for you
If any part of your supply chain touches a Panama-routed service, ask your carrier whether a surcharge applies and how it sits against your freight agreement. We can confirm this as part of your regular booking review.
Freight Market Update: Rates and Services
Global Ocean Rates
Global spot rates strengthened through August before easing slightly on some trades in the final week. Drewry’s World Container Index held broadly stable week on week, but was around 5% higher than a month earlier and more than double last year’s level. The Transpacific remains the standout, with Shanghai to Los Angeles and Shanghai to New York both climbing further to sit well over 180% higher year on year, as carriers manage capacity through blank sailings. Asia-to-Europe told the opposite story, easing on the Genoa and Rotterdam legs even though both remain well above last year.
Australia
August was defined by a widening gap between North East Asia and South East Asia markets. China-to-Australia rates held relatively stable despite ongoing congestion and typhoon-related schedule recovery, while South East Asia-to-Australia rates surged as tightening capacity, transhipment hub congestion and peak season demand combined. ANL, COSCO Shipping, MSC and ZIM/GSL all confirmed rate restorations effective 1 September, and ANL, COSCO Shipping and ZIM/GSL have followed with a second round effective 15 September, less than a fortnight later. Hapag-Lloyd has also revised terminal handling charges across Australia and New Zealand, citing rising terminal costs.
ANL has introduced peak season surcharges on services from North East and South East Asia to Pacific Island destinations including Papua New Guinea, Solomon Islands and Vanuatu, as well as the Queensland ports of Townsville and Gladstone, with a separate surcharge on Asia services to New Caledonia, French Polynesia and Fiji. CMA CGM has introduced an emergency space surcharge from North Europe, the Mediterranean and North Africa to Australia and New Zealand from 21 September, and ANL has a further restoration scheduled for 1 October on services into New Zealand. Despite additional capacity entering the trade, carriers are clearly using congestion, weather and peak season timing to sustain rates rather than compete them away.
What this means for you
Restorations stacked inside a fortnight make it easy to lose track of which increases genuinely apply to your cargo. We review restorations against agreed rates before it reaches your invoice. Request a rate review for your October bookings.
Freight Market Update: Trade Outlook
Global trade continued to expand through the June quarter despite escalating geopolitical pressure. OECD data shows G20 merchandise imports rose 6.7% and exports 5.9% over the quarter, while inflation across member countries eased slightly. Australia broadly tracked this pattern, with GDP up 0.4% quarter on quarter and 2.1% over the year, a moderate but genuine expansion.
UNCTAD is more cautious on freight specifically, noting that six months of Hormuz-related disruption have already worked through supply chains via higher transport and energy costs, and that shipping markets take longer to normalise than commodity markets do. For Australian shippers, the read is cautious optimism: trade volumes continue to expand, but ongoing restorations show carriers are still prioritising pricing discipline over volume growth.
US Shipping Update
For Australian exporters, the biggest development remains the additional 12.5% Section 301 tariff, which now applies to most Australian-origin goods entering the United States following the USTR’s forced labour investigation. Beef and gold are among the notable exemptions. Attention is shifting from implementation to the tariff’s longer-term effect on landed costs and competitiveness. The US has also continued broadening measures affecting steel, aluminium, pharmaceuticals, technology and unmanned aircraft systems.
What this means for you
If you export to the United States, model the 12.5% tariff against your landed costs and confirm your documentation is in order. Our customs and compliance team can walk you through what US Customs will expect.
Global Schedule Reliability and Port Congestion
Reliability has gone backwards. Sea-Intelligence reports global schedule reliability fell 6.1 percentage points in July to 56.4%, the weakest performance of 2026 and the lowest since February 2025, down 8.8 points on last year. Average delays for late vessels worsened to 6.06 days, the highest so far this year. A.P. Moller-Maersk remained the strongest major carrier at 73.7%, MSC recorded the sharpest decline at 11.9 percentage points, and no carrier improved on the month.
Port congestion tells a similar story. Shanghai remains more heavily congested than a month earlier, with some services delayed by over a week. Singapore, the region’s primary transhipment hub, is now tracking behind its own position from a month earlier as bunching and delayed North Asian services arrive late. Congestion is moving through the network rather than disappearing.
What this means for you
When reliability drops below 60% globally, a booking confirmation’s transit time tells you less than it used to. We build actual carrier performance, not just the schedule, into your estimated arrival dates.
Freight Market Update: Capacity Management and Blank Sailings
Global
Blank sailings are increasing as carriers prepare for China’s Golden Week. Across the major East-West trades, 79 sailings have been withdrawn from 721 scheduled voyages over five weeks, an 11% cancellation rate, with the Transpacific eastbound the most affected at over half. The pace stands out: cancellations for the preceding four-week window jumped by more than half in a single week, with further adjustments likely as Golden Week approaches.
Australia
Australian schedules show the same renewed pressure, with the blank sailing rate to and from Australia rising from 6.0% to 9.0% during the month. That remains well below the 13.9% recorded two months earlier, so Australian services still compare well against many international trade lanes, but the direction interrupts a recent trend of improving stability.
What this means for you
A rising blank sailing rate makes space harder to predict. Book earlier and keep us informed of your forward order book, so we can secure space before it tightens.
Equipment
Empty container repositioning has reached record levels. Sea-Intelligence analysis shows close to one in three containers is now moved empty, up from around one in four before the pandemic, with empty moves now 30% of global container activity by TEU-miles, up from 24% pre-COVID. Since 2019, empty volumes have grown 65%, against 17% growth in laden movements, a structural shift that adds cost flowing through to headhaul rates.
For Australian exporters, equipment availability remains a live issue, particularly for reefer and specialised units. Typhoon-related disruption in China, vessel bunching and reliability challenges are likely to keep affecting positioning across the Asia-Pacific, making both vessel space and the right box harder to secure at short notice.
What this means for you
If your cargo depends on reefer or specialised equipment, book earlier than you think you need to. We plan equipment requirements ahead of time so a wider market shortage does not become your problem.
Sustainability
New analysis published by FreightWaves this month, based on a review of over 86,000 voyages by analytics firm VesselBot, adds useful nuance to carrier sustainability claims. Global container shipping’s average emissions intensity rose 1.5% year on year in the second quarter of 2026, but that headline masks genuine gains across five of the six vessel-size categories tracked. Feeder vessels pulled the fleet-wide average the wrong way, making up almost two-thirds of all voyages and becoming less efficient over the period.
More striking, on the Northern Europe to North America East Coast trade, VesselBot found a 31.3% emissions-intensity gap between Hapag-Lloyd and MSC despite both running voyages of similar distance and port pairs. As VesselBot’s founder put it, a trade lane average tells a shipper what a route looks like on paper, not what happened on their own shipment; the gap came down to vessel deployment, utilisation and voyage execution rather than distance.
What this means for you
A trade lane average or a headline claim tells you what a route looks like on paper, not what happens on your shipment. If you want to make your freight more sustainable, ask about sustainable freight options.
Air Freight Market Update
Global
Global air cargo markets held broadly stable through late August and early September. WorldACD reports worldwide chargeable weight eased slightly week on week, reflecting renewed Middle East tensions and Southeast Asian public holidays, but volumes remained 7% higher year on year. Pricing continues to edge upward, with rates from Asia Pacific running around 15% higher to Europe and roughly 40% higher to North America year on year, supported by e-commerce demand and tight equipment. Capacity growth remains constrained by aircraft manufacturing supply chains, and airlines are redeploying freighter capacity from Asia-Europe into Transpacific markets.
Australia and New Zealand
Renewed Iran-US conflict pushed oil prices above US$100 a barrel during the period, raising the likelihood of higher aviation fuel surcharges. For Australian and New Zealand businesses, air freight remains valuable for time-critical cargo when ocean schedules are this uncertain, though firmer pricing and constrained aircraft supply make planning more important than it has been in some time.
What this means for you
When ocean transit times are unpredictable, air freight can protect a critical delivery with the right planning. We offer weekend uplifts, deferred services and multiple airline options to match speed and cost to your needs.
Terminals and Ports
Australia
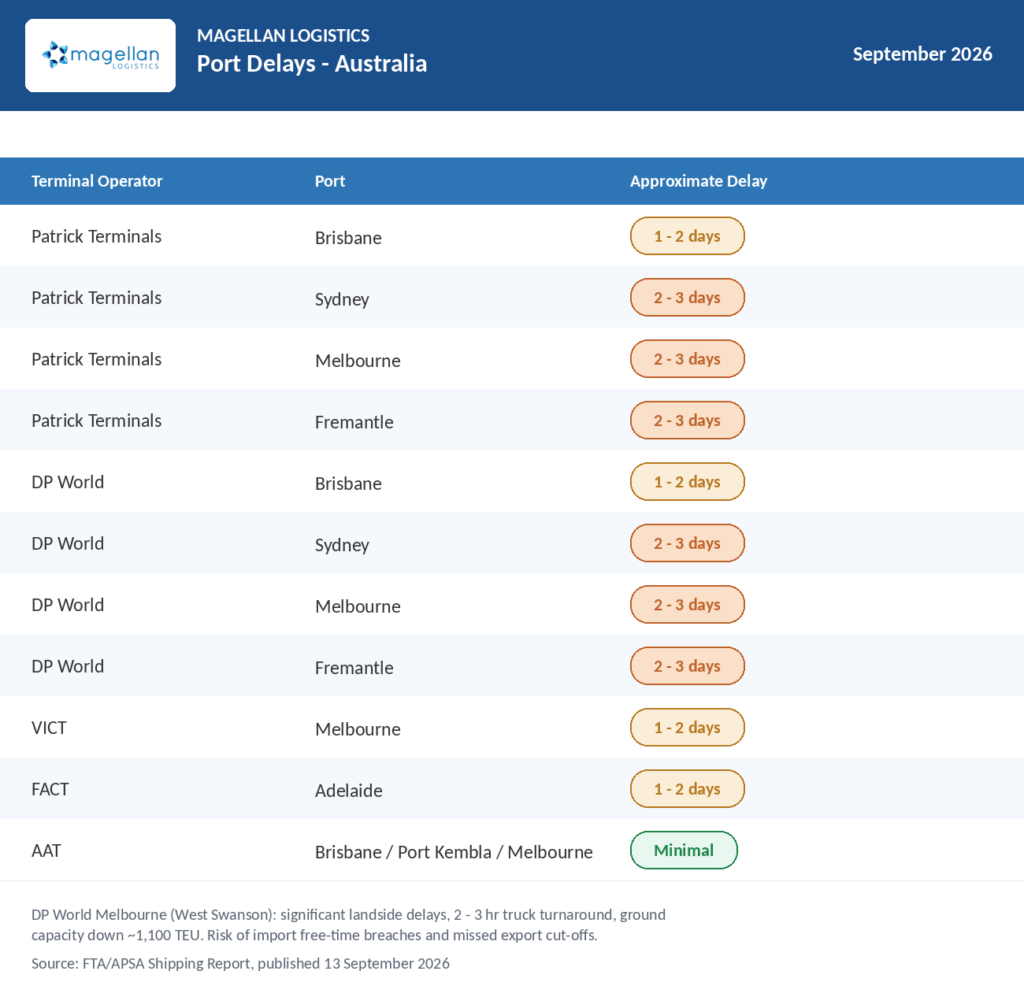
Australian Border Force cargo reporting for July shows continued year-on-year import growth, with air cargo up 10% though sea cargo down 7% on last year; export declarations, most recently reported for May in the source data, were up 2% year-on-year. DP World’s West Swanson facility in Melbourne is experiencing significant landside delays, with truck turnaround times of two to three hours, a combination of vessel bunching, higher volumes and civil works that have cut terminal ground capacity by around 1,100 TEU. Extra labour and vehicle booking slots are being added, though further pressure is likely as seasonal volumes build.
Elsewhere, delays are more moderate: Patrick and DP World terminals in Sydney, Melbourne and Fremantle are running at two to three days, Brisbane at one to two days, and AAT’s facilities with minimal delays.
New Zealand
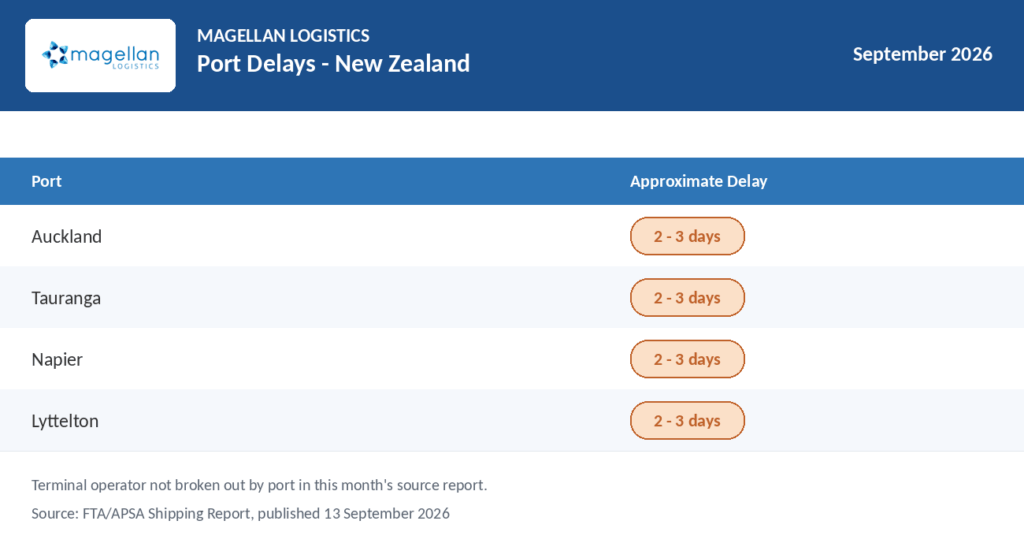
Across New Zealand, Auckland, Tauranga, Napier and Lyttelton are all running at approximately two to three days, a consistent picture across the main container ports.
Notable Infrastructure and Regulatory Developments
Two Australian developments sit outside the usual rates and delays picture. The Federal Government has refreshed the Freight Industry Reference Panel, chaired by Michael Byrne AM, with new subcommittees covering heavy vehicles, rail, and ports and shipping. Queensland has separately released its Freight Delivery Plan 2026, a five-year roadmap targeting improved rail freight access and investment in corridors including the Bruce, Warrego and Flinders Highways. Neither changes rates or transit times immediately, but both signal where freight policy priorities are heading.
What this means for you
Terminal delays and port charges affect your landed cost and delivery timing as much as ocean rates do. We track terminal performance across Australia and New Zealand to route your cargo around the worst of the current congestion.
The Bottom Line
The freight market heading into the final quarter of 2026 is defined less by any single crisis than by several arriving at once: typhoon-driven rate surges in Asia, back-to-back restorations in Australia, a Middle East that has not settled, and now a Panama Canal running below its usual capacity. Schedule reliability is at its weakest point of the year, equipment remains tight, and Golden Week is likely to add another layer of disruption before conditions stabilise.
None of this is cause for alarm, but all of it rewards planning ahead. This is exactly the environment where a dedicated freight forwarding partner earns its place. With 28 years of industry experience, customs licensing across Australia and New Zealand, and dedicated account managers who own the problem on your behalf, Magellan Logistics helps you navigate the complexity so you can focus on running your business.
If you would like to review your freight strategy ahead of the final quarter, we would be glad to help. Speak to an expert, and let’s start a conversation about propelling your business forward.
Read previous freight market updates and the latest logistics insights at Freight Forwarding News and Insights – Magellan Logistics
About David Thatcher: David, founder of Magellan Logistics, has built a global career in freight forwarding. With international leadership experience and Harvard training, he remains committed to client needs and nurturing his team.
Sources: With thanks to the Freight and Trade Alliance for their freight market update. Figures attributed to Drewry, Sea-Intelligence, WorldACD, UNCTAD, Australian Border Force, and the Australian Bureau of Statistics, as reported in the latest FTA/APSA Shipping Report.