
This month’s freight market update shows May 2026 is shaping up as one of the more demanding months for Australian and New Zealand importers since the pandemic era. Geopolitical disruption in the Middle East is no longer a background risk – it is actively reshaping freight routes, inflating insurance and fuel costs, and squeezing capacity on key lanes into Australia. Rates that held relatively steady through the early part of the year have now moved sharply, and the coordinated nature of carrier rate actions in May signals that the increases are here for the medium term.
The picture is not uniformly negative. Schedule reliability has improved, congestion at several key regional hubs has eased, and volumes remain solid. But the cost environment demands close attention. This freight market update covers what has changed, what it means for your supply chain, and where the risks lie for the months ahead.
TL;DR – Global Freight Market Update May 2026
- Middle East: Strait of Hormuz classified at CRITICAL risk. Daily vessel transits are running at roughly 5% of pre-conflict levels. War risk premiums have reached 3-5% of hull value on some voyages.
- Ocean rates: Drewry World Container Index at US$2,216 per 40ft container as at 30 April, easing 1% week-on-week. Market is choppy rather than collapsing. SCFI at 1,875.
- Australia: China-Australia lanes surged in April – SCFI Shanghai-Sydney up 19% in a single week. Coordinated rate increases from ANL, COSCO, MSC, ZIM, GSL and CMA CGM took effect 1 May.
- Intra-Asia: Drewry IACI reached US$890 per 40ft by 24 April, up 61% from its late-February low of US$552.
- Trade outlook: UNCTAD now forecasts 2026 global merchandise trade growth of 1.5-2.5%, down sharply from 4.7% in 2025.
- Schedule reliability: Global reliability reached 62.2% in March, the best result of 2026. Late vessels averaged 5.48 days behind schedule.
- Blank sailings: Global cancellation rate for weeks 19-23 is 6%. Australia is running at 11.2%.
- Equipment: 20GP, 20RF, 20FQ and 40RF units remain in short supply at Australian ports.
- Air freight: Asia Pacific spot rates are more than 40% above last year. Gulf air cargo capacity is 46% below pre-conflict levels. Jet fuel hit a 23-year high in March.
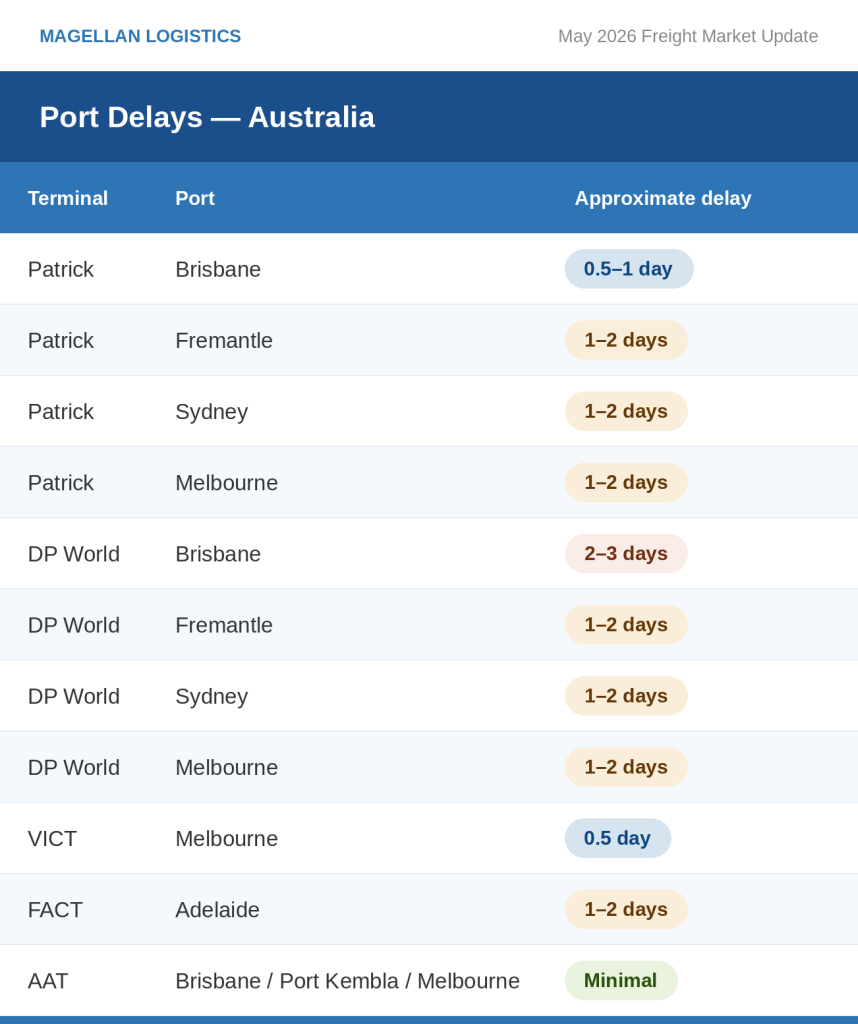
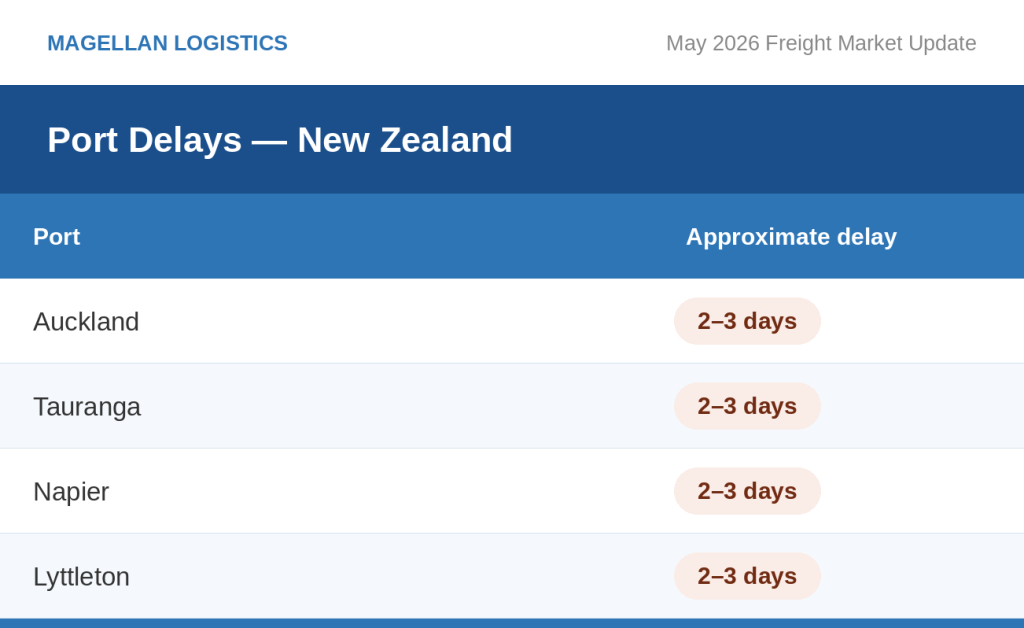
- AU/NZ terminals: Most Australian ports are showing delays of 1-3 days. New Zealand ports across Auckland, Tauranga, Napier and Lyttleton are running 2-3 days.
Freight Market Update – Middle East Disruption
The situation at the Strait of Hormuz has moved well beyond a short-term disruption. Since early March, daily ship transits through the Strait have fallen by approximately 95%, from a pre-conflict average of 125 to 140 vessels per day to around six. That is not a rounding error – it represents a near-complete halt to one of the world’s most strategically important shipping corridors.
Vessels that do transit must obtain prior clearance from Iran’s Islamic Revolutionary Guard Corps and move within Iranian-designated corridors rather than the internationally recognised traffic separation scheme. The Joint Maritime Information Center is maintaining a CRITICAL risk classification across the Arabian Gulf, Strait of Hormuz and Gulf of Oman, citing active missile and UAV threats, mine risk, GPS spoofing and continued vessel seizures. Several container ships, including MSC-operated vessels, have been fired upon or detained, and most major carriers have responded by suspending bookings, voiding voyages or rerouting cargo away from Gulf ports entirely.
What AU/NZ Shippers Need to Know
- The insurance cost of transiting the Gulf has risen from around 0.15% of hull value before the conflict to as high as 3-5% on some voyages. Cover is typically only available voyage by voyage, with pre-approval required. This cost is working its way into freight rates and surcharges across multiple trade lanes, including those with no direct Gulf exposure.
- Energy, fertiliser and industrial input costs are all being affected. If your products or your suppliers’ inputs rely on Gulf-sourced materials, review your landed cost assumptions now.
- Ceasefire announcements have not changed commercial reality. Insurers and shipowners are not returning to pre-war operating conditions until mine risk is resolved and the security situation is independently verified. Do not plan around political headlines.
Red Sea Update
The Red Sea picture has improved in isolation, but remains complicated by its proximity to the Hormuz crisis. The JMIC has moved the Bab el-Mandeb, Gulf of Aden and Southern Red Sea to a MODERATE risk rating, with no confirmed maritime attacks in recent weeks, though Houthi rhetoric continues. Suez Canal transits are operating normally in the Northern Red Sea, with the Suez Canal itself rated MODERATE.
Around 50 vessel transits were recorded through Bab el-Mandeb in a 72-hour window to 26 April – vessels are moving, but volumes remain well below pre-2023 levels. CMA CGM has begun routing two services back through Suez, which may encourage other carriers to follow. However, the Arabian Gulf and Gulf of Oman remain at CRITICAL, and carriers evaluate the region as a connected risk zone rather than a series of separate passages. A return to normal Suez Canal operations is therefore unlikely while Hormuz remains effectively closed.
Meanwhile, Somali piracy has re-emerged as a concern. The JMIC upgraded the Somali Coast and Somali Basin to SUBSTANTIAL risk following a cluster of incidents in late April, including reported vessel boardings. This adds risk to the Cape of Good Hope routing that many carriers adopted as their Suez alternative.
The Suez Canal Authority’s decision to withdraw its 15% transit fee discount for large containerships, effective 7 April, is also telling. The rebate was introduced to draw vessels back to the canal. Its removal reflects the Authority’s own acknowledgement that pricing incentives have not been sufficient to change carrier behaviour where underlying security risk persists.
What this means for you:
- If your cargo touches Europe-APAC corridors, build meaningful buffer into your ETAs. Suez, Cape and Gulf routing all carry operational risk at present and schedule variability is higher than usual.
- Review your supplier base for any direct or indirect exposure to Gulf-origin materials, including fertilisers, chemicals, petrochemical resins and energy inputs.
- War risk surcharges, fuel surcharges and contingency fees are likely to remain on invoices through the rest of 2026. Ask your forwarder to itemise and justify each one – a good freight partner will welcome the question.
- Political announcements about ceasefires or strait access should not change your planning horizon until the insurance market and major shipowners confirm a return to normal commercial operations.
Rates and Services
Global Ocean Rates
At the global level, spot rates have settled into a choppy, mixed pattern rather than continuing either the rally seen earlier in the year or a sharp correction. The Drewry World Container Index stood at US$2,216 per 40ft container as at 30 April, easing 1% on the prior week. Asia-Europe lanes have softened, while some Transpacific and Transatlantic lanes have held firmer. Drewry’s view is that excess capacity and subdued demand are keeping a lid on rates globally, despite elevated fuel costs and persistent geopolitical risk.
The Shanghai Containerized Freight Index came in at 1,875 on 24 April, marginally below the prior week’s 1,886. The Freightos Baltic Index tells a similar story – a global market that is neither collapsing nor recovering with conviction.
The exception is intra-Asia. Drewry’s Intra-Asia Container Index reached US$890 per 40ft by 24 April, a rise of 26% year-on-year and 61% above the nine-week low of US$552 it touched in late February. The speed of that recovery reflects how quickly regional markets respond to geopolitical stress – particularly when transshipment hubs serving feeder networks come under pressure.
Australia
The relative calm in Australian import rates through the first quarter of 2026 ended sharply in April. The SCFI Shanghai-Sydney index rose 19% in a single week in late April, on top of increases of 7%, 14% and 12% in the three preceding weeks. That is a cumulative move of more than 50% in four weeks – and it arrived at the same time as a coordinated set of carrier rate actions taking effect on 1 May.
ANL, COSCO and MSC have implemented increases of approximately USD 300 per TEU (USD 600 per FEU) across both North East and South East Asia-Australia trades. ZIM and GSL have added further General Rate Increases through April and May. CMA CGM has introduced a Peak Season Surcharge on selected Europe-Australia services alongside new inland fuel surcharges. This is not a single carrier testing the market – it is an industry-wide move, and the alignment across carriers on both the quantum and timing of increases suggests the pricing will hold.
South East Asia-Australia rates had been remarkably stable for much of 2026, averaging around USD 1,625 per FEU according to Xeneta data – little changed week on week despite repeated GRI notifications. That stability is now ending, and businesses that budgeted on those rates for the second quarter need to revisit their numbers.
The supply side is also tightening. Blank sailings remain elevated, SeaLead is exiting the trade, and there is market speculation about reduced sailing frequency on MSC’s Kangaroo service. Congestion at Singapore, causing delays of around two days, is adding further pressure to regional capacity flows. The drivers of the current rate environment are partly supply-side discipline rather than a surge in cargo volumes – which means the increases may be difficult to reverse quickly even if demand softens.
What this means for you:
- If you have China-Australia shipments planned for May or June, secure space and confirm rates now. The window for locking in cost certainty is narrowing.
- Revisit your landed cost assumptions for any product sourced from North East or South East Asia. The coordinated GRIs represent a meaningful shift in the cost base.
- Be prepared to interrogate surcharge line items on your invoices. With multiple carriers implementing new charges simultaneously, there is a risk of duplication or unjustified pass-through. A good freight partner will explain each charge clearly.
Trade Outlook
Global trade had genuine momentum heading into 2026. Goods and services trade grew by around US$2.5 trillion through 2025 to reach approximately US$35 trillion, and Q1 2026 continued that trajectory, particularly in physical goods. But the outlook for the remainder of the year has deteriorated meaningfully, and the United Nations now expects growth to slow sharply as geopolitical tension, protectionism and rising logistics costs combine to weigh on activity.
One of the more significant shifts in the current environment is that trade growth is increasingly being driven by price rather than volume. Trade inflation has rebounded in Q1 2026, as energy costs, transport costs and compliance costs work their way through supply chains. Businesses shipping the same number of boxes are paying more for the privilege – and that dynamic is unlikely to unwind quickly.
Structurally, the geography of global trade continues to shift. UNCTAD data points to growing trade concentration through South-East Asian connector economies, which are absorbing flows that previously moved directly between the US and China. Friend-shoring and near-shoring trends are accelerating rather than stalling. For Australian importers, this creates both opportunity and complexity – supply chain diversification is worth planning for, but it introduces new routing, compliance and lead time considerations.
Manufacturing remains the strongest sector globally, led by machinery, electronics and AI-related equipment, with continued volume in wind energy components, batteries and hybrid vehicles. These sectors are performing well but are not large enough to offset broader headwinds across the trade economy.
US Shipping Update
The United States tariff environment remains genuinely unsettled. The Supreme Court ruled that the administration’s broad IEEPA-based tariff measures were unlawful, and US Customs and Border Protection has opened a refund process as a result. First refunds are expected from around 11 May 2026, with total refunds potentially approaching US$166 billion across more than 330,000 importers.
However, the administration is simultaneously pursuing replacement measures through separate legal authorities, including Section 122 temporary import duties, Section 301 tariffs and Section 232 national security tariffs covering steel, aluminium, automotive products and other strategic goods. Businesses with US-bound or US-origin trade are therefore navigating a two-track situation: pursuing refunds on tariffs that have been struck down while preparing for a parallel set of replacement measures. Winning in court has not translated into lower costs at the border.
What this means for you:
- If you import or export goods with US exposure, do not assume that the Supreme Court ruling resolves your tariff risk. Seek current advice on which specific classifications apply to your products and what replacement measures may affect them.
- Build policy uncertainty into your US-trade cost modelling for the rest of 2026. The regulatory picture is unlikely to stabilise quickly.
Global Schedule Reliability
There is genuine good news in the reliability data. Sea-Intelligence reported global schedule reliability of 62.2% in March 2026, a 3.9 percentage point improvement on the prior month and the joint-best result of the year so far. It also represents a 5.2 percentage point improvement on March 2025, suggesting the industry is making real progress on this metric despite the disruption environment.
Hapag-Lloyd set the pace among individual carriers with a schedule reliability of 72.3% in March, followed by Maersk at 70.8%. Eight carriers fell in the 60-70% range. Only two of the 13 carriers tracked saw reliability fall month-on-month, while 11 improved on their year-ago performance.
On delays specifically, the average late arrival came in at 5.48 days in March, a 0.14-day improvement on February. That figure is still 0.36 days above the same period last year, so the trend is moving in the right direction, but delays when they occur remain material.
Global Port Congestion
Port congestion has shifted from the acute, diversion-driven pressure seen in March to a more diffuse picture in April. The intense strain at Arabian Sea and Indian Ocean hubs – Salalah, Khor Fakkan, Sohar, Mundra and Colombo – has eased somewhat as carriers have settled into more predictable rerouting patterns. Singapore, which saw significant bunching and extended berth waits in March, has returned to more manageable conditions. Africa continues to experience congestion, but it is shaped by schedule variability from upstream rather than local bottlenecks. Europe is broadly stable.
What this means for you:
- Reliability is improving, but an average late arrival of 5.48 days means your ETAs need a buffer built in. If a shipment is critical to a stock deadline, plan around a worst-case arrival, not the scheduled one.
- The improvement in congestion at key transshipment hubs is a positive sign, but conditions can shift quickly when blank sailings or diversion decisions change the flow of vessels through a hub. Keep close to your account manager as vessels approach.
Capacity Management and Blank Sailings
Global
Carriers are still actively managing capacity in response to the Hormuz disruption, though the pace of adjustment has moderated. Across weeks 19 to 23, approximately 43 blank sailings are expected against 689 scheduled departures – a 6% cancellation rate, meaning 94% of services are still planned to run. The highest concentration of blanks is on Asia-Europe and Mediterranean services (42% of cancellations) and Transpacific eastbound (40%), while the Transatlantic is less affected at 18%. The Gemini Cooperation has reported no cancellations across its major east-west lanes.
There are tentative signs of stabilisation emerging as carriers adjust to the new routing environment, and spot rates have eased slightly on some lanes as a result. But longer voyage times, higher operating costs and shifting network configurations mean that shippers need to maintain more flexibility in their planning than they would in a settled market.
Australia
Australia’s blank sailing rate of 11.2% sits noticeably above the global average and well above the Lunar New Year period rate of just under 9.5%. Carriers are managing Australian capacity with deliberate caution, keeping supply tightly aligned with current demand levels. The slight improvement from April’s peak is welcome, but a double-digit cancellation rate is not a stable baseline – it reflects an industry still managing through uncertainty rather than one that has found equilibrium.
What this means for you
- A blank sailing rate of 11.2% means roughly one in nine services into Australia is cancelled. If you are loading to a tight deadline, confirm your vessel is operating before committing to inland transport and labour bookings.
- Where your cargo allows, consider spreading bookings across more than one carrier or service. Single-service dependency is a planning risk in this environment.
- For cargo on Europe-APAC lanes, factor in the likelihood of extended transit times as carriers continue to navigate around the Gulf. Longer routings via the Cape are adding two to three weeks to some voyages.
Equipment
Container availability remains a live issue at Australian ports. Shortages are most pronounced for 20GP, 20RF, 20FQ and 40RF equipment, with demand for refrigerated and flexi-tank units consistently outpacing supply. Temperature-sensitive agricultural exports and bulk commodity shipments are the most affected, but the tightness in standard dry containers is also a constraint for some exporters.
What this means for you:
- Do not leave equipment booking to the last week before your cut-off. In the current environment, treating container availability as guaranteed is a planning risk.
- If your cargo is temperature-sensitive or requires specialist equipment, raise the booking with your account manager as early as possible and confirm availability before locking in production or harvest schedules.
Sustainability
The International Maritime Organization’s Marine Environment Protection Committee concluded its latest round of meetings without reaching agreement on a final Net-Zero Framework. Two weeks of detailed negotiations produced what the IMO described as constructive progress and renewed momentum, but member states settled on continuing discussions through working group sessions in September and November, ahead of a formal MEPC session from 30 November 2026 and an extraordinary session on 4 December.
Support for a framework is growing among many flag states, and both the World Shipping Council and the International Chamber of Shipping have characterised the process positively. But meaningful opposition remains, led by the United States, Saudi Arabia, Liberia, Panama and Argentina, who have pushed back on carbon pricing mechanisms and the economic implications of emissions-based charges. Australia has expressed concern that continued delay risks undermining the process altogether.
On a more practical note, Singapore, Los Angeles and Long Beach have extended their Green and Digital Shipping Corridor agreement for three further years. The renewal is significant because it moves the conversation from aspiration to implementation, providing enough policy certainty for industry to invest in alternative fuel pathways, compatible vessels and port infrastructure along one of the world’s busiest container routes. Singapore has also issued an Expression of Interest for autonomous feeder vessels to operate between its port terminals – a practical response to growing vessel traffic and labour constraints rather than a conceptual exercise.
What this means for you:
- Decarbonisation regulation is coming. The IMO timeline may shift, but the direction is set. If your customers or investors are asking about emissions transparency across your supply chain, the time to build that capability is now, not when regulation forces the issue.
- Watch the November and December MEPC sessions closely. Agreement on mid-term measures in late 2026 would have significant implications for freight costs from 2027 onwards.
Air Freight Market Update
Global
The Middle East conflict has been as disruptive to air freight as it has been to ocean freight – arguably more so in proportional terms. IATA data for March shows global air cargo demand down 4.8% year-on-year, with capacity down 4.7%. The headline figures understate the regional impact: Middle Eastern carriers saw demand fall 54.3% and capacity fall 52.4% year-on-year, reflecting the near-total disruption to Gulf hub airport operations.
Gulf carrier capacity has not recovered. Measured against early February levels (before the conflict began), global air cargo capacity in late April was still around 3% below where it was, with the Middle East and South Asia region down approximately 26% and Gulf-specific capacity running close to 46% below pre-conflict levels. These are not marginal adjustments – they represent a fundamental reshaping of air cargo network capacity in one of the most commercially important hub regions on the planet.
Jet fuel is compounding the challenge. IATA reported a 106.6% year-on-year increase in jet fuel prices in March, the highest level in more than 23 years. This has pushed cargo yields up by nearly 19% and is creating what IATA describes as a distinctly inflationary pricing environment. The concern for the months ahead is not just cost but availability: ongoing supply disruption linked to Hormuz could tighten fuel access further and extend the period of elevated airfreight rates.
Despite all of this, volumes have held up. In the week of 20 to 26 April, worldwide air cargo tonnages were 9% above the same period last year, driven by seasonal demand and pre-holiday shipping activity. Asia Pacific volumes grew 3% week-on-week and were 8% higher year-on-year, reinforcing the region’s role as a primary source of global air cargo demand.
In rate terms, global spot rates reached around US$3.76 per kilogram, with full-market rates averaging approximately US$3.19 per kilogram. Asia Pacific spot rates are running more than 40% above this time last year.
Australia and New Zealand
Air freight operations into Australia are functioning, but Middle East airspace restrictions and hub disruptions remain a material variable for anything that transits the Gulf region. For cargo that normally moves via Dubai, Doha or other Gulf hubs, plan with contingency routings in mind and do not rely on single-carrier uplift for time-critical shipments.
New Zealand has some good news to report. Menzies Aviation has opened a dedicated airside cargo terminal at Auckland Airport – the first of its kind at that facility – effectively doubling its operational footprint. The new 32,000 square metre facility works with 18 airline cargo partners and is purpose-built for pharmaceuticals, perishables and e-commerce. It arrives at a useful moment: Auckland has seen fresh produce air freight volumes grow 34% year-on-year over the recent summer season, and the additional capacity will strengthen Oceania’s ability to handle peak export periods during a period of global network stress.
What this means for you:
- For time-sensitive or perishable cargo moving via Gulf hub airports, build contingency routing into your plan now rather than scrambling when a disruption occurs. Discuss alternative carrier options and transit hubs with your account manager before you need them.
- Confirm uplift bookings early and reconfirm cut-off times 24 to 48 hours before handover. In a constrained capacity environment, late cargo risks being left behind.
- Air freight is significantly more expensive in 2026 than it was in 2025. If you are using air freight to compensate for ocean freight delays, ensure the cost-benefit calculation reflects current rates rather than historical benchmarks.
Terminals and Ports
Australian Border Force cargo data for March 2026 confirms that cargo volumes are growing strongly in year-on-year terms. A total of 15.7 million cargo reports were lodged in March, up 17% on the same month in 2025. Air cargo accounts for the majority of that volume, with 15.2 million reports lodged, up 17% year-on-year. Sea cargo reports reached 547,000, also up 15%. Volume growth at this level puts pressure on port infrastructure and landside logistics, particularly in an environment where terminal delays are already elevated.
Notable Infrastructure Developments
Two significant Australian port investments deserve attention. The federal and Western Australian governments have together committed $1.1 billion toward road infrastructure supporting the proposed Westport container terminal in Fremantle, with the Commonwealth contributing $552 million and the State matching it. Westport is designed to handle the next generation of large vessels and relieve pressure on the existing Fremantle inner harbour. The investment signals a long-term commitment to Western Australian trade capacity, though the terminal itself remains years from operation.
Closer to operation, Port of Melbourne has named MEDLOG as the major tenant for the redevelopment of the former Melbourne Market site – a 29-hectare precinct being repositioned as an integrated freight facility directly connected to port operations. The intent is to bring container storage, warehousing and heavy vehicle facilities closer to Swanson Dock, reducing the volume of container truck movements through Melbourne’s inner west and improving the efficiency of the landside freight chain. For importers using Melbourne, this is a development worth watching as it moves toward operation.
What this means for you:
- With Australian port delays running at 1-3 days across most terminals, your inland transport bookings and labour scheduling need buffer built in. Assume the worst-case delay, not the best-case ETA.
- Container shortages are affecting 20GP, 20RF, 20FQ and 40RF units. If you are exporting goods that depend on refrigerated or specialist equipment, confirm availability with your account manager well ahead of your planned ship date.
Bottom Line
May 2026 is a month for active supply chain management, not passive monitoring. The Hormuz disruption is structural – it is reshaping insurance costs, fuel pricing, trade routes and carrier network decisions in ways that will not resolve quickly. Australian importers face a higher cost environment on China and South East Asia lanes, tighter capacity and a blank sailing rate that means confirmed space matters more than it did six months ago.
At the same time, schedule reliability is trending in the right direction, volumes are holding up, and the market is functioning – just at a higher cost and with more complexity than we saw in 2025. Businesses that plan carefully, secure space early and work with a freight partner who is transparent about costs and proactive with information will navigate this environment better than those who do not.
If you would like Magellan to review your routings, landed cost assumptions or contingency options for the months ahead book a logistics review or speak to your dedicated account manager today at AUS 1800 595 463 or NZ (09) 974 4818.
Related Reading
About David Thatcher: David, founder of Magellan Logistics, has built a global career in freight forwarding. With international leadership experience and Harvard training, he remains committed to client needs and nurturing his team.
This Australia freight market update is published regularly by Magellan Logistics. With thanks to the Freight and Trade Alliance for its freight market update.
Subscribe to receive the latest shipping market intelligence direct to your inbox.